Crowdsourcing Mapping; A case study for School Mapping in Tarauni LGA
Background
Under the key premise that information leads to opportunity, leads to choice, leads to better outcomes, UNICEF Office of Innovation is building a framework to measure a child’s access to information. 1500 calories per day is enough for a child to be nutritionally healthy. How many kilobytes (and of what type) could provide us a measure of a child's _information_ health? What if we could determine the minimum amount and type of kilobytes a day a child should consume to be ‘information healthy’? UNICEF is motivated to determine and establish some minimum standards around information quality and quantity that children need to consume (kilobytes/day). We can then build sustainable infrastructures and programmes, and make informed decisions for children that will lead to equal access to relevant information, opportunities, and choices.
As part of the Information Poverty multidimensional framework, and as first step towards an equal world where every child has access to quality education and relevant information, UNICEF Office of Innovation is working on mapping every school in the world.
By mapping education facilities and assessing the status of their infrastructure, we can identify gaps and weaknesses in service coverage and inform UNICEF’s internal programming as well as external partners. Overlaying this data with other data sets such as population maps and coverage, can help us identify most vulnerable communities, focus the response efforts and advocate for and provide the necessary services.
Challenge - Statement of the Research Problem
Mapping schools is a very simple thing to describe but a very difficult thing to do. In fact, some national governments don’t know where all the schools in their country are, meaning they can’t adequately provide services to them. Having this base layer of information allows us to know what are the connectivity and infrastructure gaps that we need to address in order to improve children’s access to information and education.
But it also allows us to do many other things such as measuring vulnerabilities and improving our emergency response and resilience against natural disasters and crisis. It’s also simple enough to describe and broad enough to tackle that allows us to bring in different partners from different sectors.
Solution: crowdsourcing
What is crowdsourcing
Crowdsourcing is the collective generation of media, ideas, and data undertaken voluntarily by many people. The crowd as a metaphor signifies the power that can emerge from a mass of individuals converging to tackle a set task (11), for individuals or small groups of volunteers this kind of challenge is simply too daunting but, given many thousands of participants, the task can be subdivided and solved. Crowdsourcing then is premised on mass participation, with distributed voluntary effort, and a degree of coordination; it harnesses the ‘wealth of networks’ (3) to utilize “non-market and non-proprietary” production, both by individual’s alone and by cooperative efforts in a wide range of loosely or tightly woven collaborations. Crowdsourcing has become a commonly used term by a lot of people and organizations in different sectors of the economy and commercial world. They include the following; crowdvoting, crowdfunding, crowdsearching, crowdsourcing creative work, and crowdmapping etc. (19)
Volunteered Geographic Information (VGI) another name for Crowdsource mapping as referred to by (8) is the aggregation of crowd-generated inputs such as text messages and social media feeds with geographic data to provide real-time, interactive information on events such as wars, humanitarian crises, crime, elections, or natural disasters (14). Crowdsource mapping project is made available through the use of different platforms on the internet (Web.2.0), the emergence of crowdsourced maps can help facilitate gaps in data collection, which often creates a problem for disaster management. Collecting reports from affected citizens in real time via mobile text message and social media fill the gap of data availability immediately after the disaster. This insightful information, where and what help is needed, cannot be conveyed through satellite photos to mobilize responders with the specific resources required (10). The various types of crowdsourcing platforms are usually based on the type of project, availability to users and proprietary.
Crowdsource mapping, lays claims that Crowd’s input to mapping helps fill a hole created by a decline in government funded mapping. Another advantage of crowdsource mapping over other conventional forms of mapping is funding, which plays a big role when working on a very large project, the funds required to pay hundreds of mappers for a project could be outsourced to voluntary mappers around the world for a little fee. A genuine statistical reason why crowdsource is off a better advantage over other traditional methods of mapping, is that it performs and produces better results compared to expert inputs. Take prediction, for example, when the disparate guesses of a large number of people are averaged out, the results are often better, and more accurate, than that of an individual expert. According to (8) locals may be able to provide early warning of natural disasters because they are familiar with the area, while satellites only pass infrequently over that area.
State of the art / Examples of similar work done before
The first recognized crowdsourced map focusing on emergency support is the Ushahidi’s crisis map service. Launched during the 2010 Haiti earthquake for emergency relief, the crisis map service demonstrated its potential benefits in aid efforts (10). Most of the crowdsourcing mapping platforms like OpenStreetMap (OSM) are setup to map all geographic features and objects in reality, while a few of them are setup for specific projects for example http://www.geo-wiki.org. A few of them like ArcGIS online require that you have a user licence before you can be granted access to the platform for voluntary mapping, but for the purpose of this research we will be using the OpenStreetMap solution due to the fact that it’s the largest voluntary crowdsource mapping platform in the world with a large dataset repository of over 2 billion edits and more than 1.6 million users; this includes editors and validators. In addition OSM is the one that has been researched the most in the literature studies(15).
Below some examples of applied work on crowdsourcing efforts:
- Maharashtra Remote Sensing Applications Centre (MRSAC) has done several projects on school mapping in the western region of India, in which primary, upper primary and secondary schools’ infrastructure was mapped. The objective was to provide access to education to children based on certain criteria like; 1. Primary education facility withn 1 km, 2. Upper primary education facility within 3km vicinity, 3. Secondary education facility within 5km vicinity. Using Web applications as a methodology they were able to map over 97000 schools
- Kenyan School Mapping Project, whose objective was to collect such data for all Kenyan learning institutions and to integrate them in a GIS database that could be queried to provide useful information for educational planners, other professional users and average citizens. Results show that at the time of the project, there were nearly 73000 learning institutions in Kenya, ranging from early childhood schools to universities that were mapped using the GIS and conventional GPS collection methods.
Benefits of crowdsource mapping
Crowdsource mapping isn’t only used for school mapping but also used majorly in Crisis Mapping. Crisis Mapping as defined by (19) as a real-time gathering, display and analysis of data during a crisis, usually a natural disaster or social/political conflict violence, elections, etc. Its greatest function aroused as it was used to aid humanitarian effort when Haiti was hit by a major earthquake in 2010, Humanitarian OpenStreetMap (HOT) requested the help of thousands of VGI to map out affected areas and produced a crisis map that helped for proper local coordination.
More to the amazing usage of VGI, Ushahidi’s crowdsource mapping platform in 2010 helped map out the largest accidental offshore oil spill in the history of petroleum industry ever recorded in Louisiana, USA.(18). Other platforms like Tomnod were used to search for pieces of the missing Malaysia Flight 370 Aircraft, Searching and Mapping out the location of Antarctic Weddell Seals Animals prone to extinction (21) while MapSwipe is part of the Missing Maps project, which aims to map the places in the world ‘where the most vulnerable people live before a crisis happens. MapSwipe is really accessible, easy to use and quite enjoyable. Finally, crowdsource mapping can be used to identify where communities are located, also give these mappers the ability to use their talents to map the towns and villages in these areas without having to search through miles of jungle and bush to find them, saving time and helping to put valuable data into the hands of field teams even faster (20). As to why people volunteer their time, one explanation is the desire to contribute to the common good, and to gain recognition from others, as is the case with the academic community.
In summary, the main benefits of crowdsourcing are:
- Scalability: One major advantage of crowdsourcing platforms is their high scalability, the system is usually designed to accommodate for the increasing numbers of users and functions. For example the OSM platform is highly scalable to accommodate for multiple Mapathon, and simultaneous API data pulls
- Low cost: Given the fact that most crowdsourcing platforms are open and free makes it easier to deploy for work. And in situations where cost are incurred, the price is usually small and affordable.
- Can access hard to reach areas: some crowdsourcing platforms like OSM, Google maps etc provides access through satellite imageries to areas where accessibility is an issues, thereby aiding experience mappers to identify some features.
Selected Methodology
The platform we selected for this pilot is OpenStreetMap. The OpenStreetMap is an Open crowdsourcing mapping platform which has been in active since 2006, and its dataset is freely available online. Spatial objects in OSM are of three types as follows; Nodes, Ways, and Relations (15), the nodes are represented with Point features and could map Points of Interest (POIs) e.g. buildings, Place of Worship, Schools etc., while Ways represents linear features on the earth surfaces like Roads, Streams and Railways, finally Relations are used for grouping other objects together based on their relationships e.g. Administrative boundaries (13).
Pilot description
Study Area
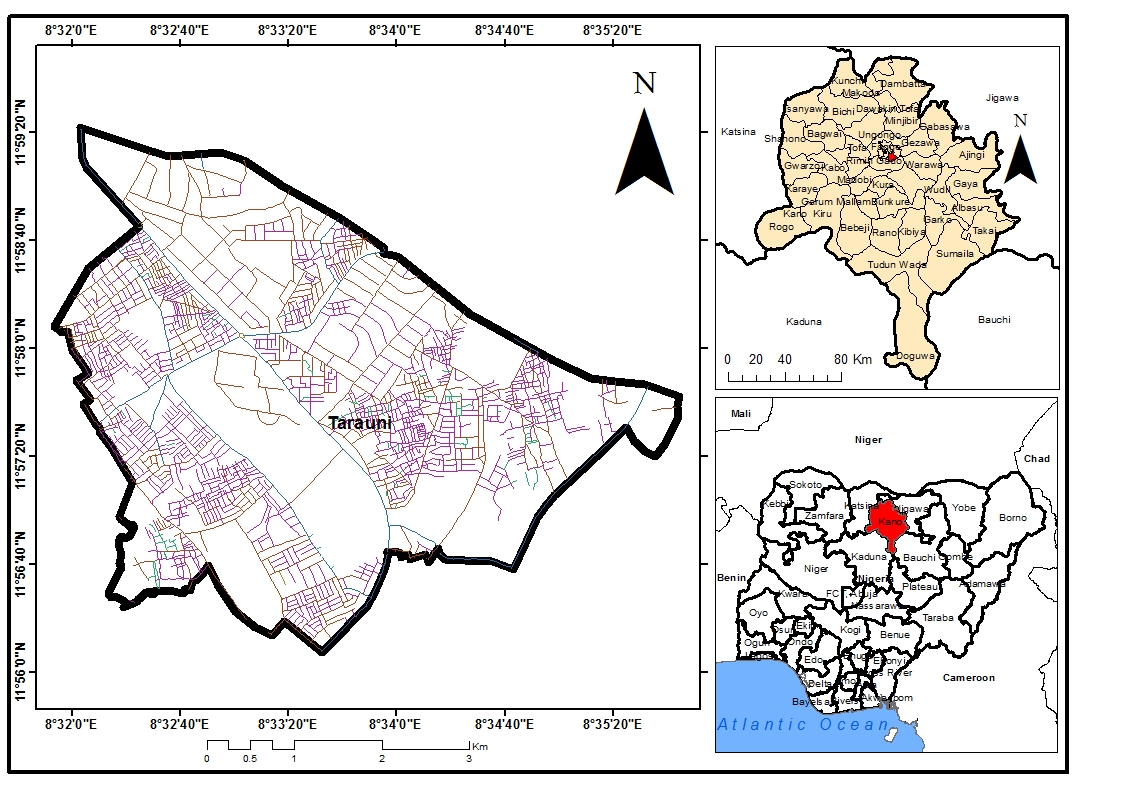
Figure 1: Map of Tarauni LGA
Location
Tarauni is a Local Government Area in Kano State, Nigeria. Its headquarters are in the locality of Unguwa Uku within the city of Kano. The study area lies within the Latitudes 11°56'00''N and 11°59'20''N and Longitudes 08°32'00''E and 08°35'20''E. It has an area of 28 km² and a population of 221,367 at the 2006 census. The postal code of the area is 700. The Local Government has ten (10) Wards which includes: Tarauni Ward, Gyadi-Gyadi Arewa Ward, Gyadi-Gyadi Kudu Ward, Darmawa Ward, Daurawa Ward, Babban Giji Ward, Hotoro Ward, Unguwa Uku Cikin Gari Ward, Unguwa Uku Kauyen Alu Ward; and Unguwar Gano Ward. Tarauni Local Government Area is bounded on the north by Nassarawa Local Government, by the east and south by Kumbotso Local Government and on the western by Municipal Local Government. The study area is predominantly inhabited by Hausa/Fulani tribe. Other ethnic groups in the local government area include Yoruba, Igbo, Ebira, and Kanuri etc.
The climate of the study area is the tropical dry-and-wet type, classified by Koppen's as Aw. The movement of the Inter-Tropical Discontinuity (ITD) gives rise to two seasons (wet and dry seasons). The wet season lasts from May to mid-October with a peak in August while the dry season extends from mid-October of one calendar-year to mid-May of the next. The annual mean rainfall is between 800 mm to 900 mm, and variations about the annual mean values are up to ± 30%. The mean annual temperature is about 260C (Falola, 2002; Olofin, 2008). Rivers Kano, challawa, Watari, Jatau, and Dudurun Gaya join the Hadejia, which empties into the Lake Chad formation further east. Several man-made lakes such as Tiga, Challawa Goge, Gari, Jakara, watari, Guzuguzu, Kafin chiri, Dundurun Gaya, Bagauda have been constructed to improve portable water supply to towns and villages, and to provide water for irrigation(1).
The area is characterized by rocks of the Basement Complex of pre- Cambrian age to the west and south, and the Chad formation to the northeast. The relief can be described under three types which are found in three zones. These are: the south and south-eastern highlands, the middle and western high plains and the north eastern low Chad plains. The first two types are part of the High Plains of Hausa land and the third is part of the Chad Plains (1).
Kano is 481 meters (or about 1580 feet) above sea level. The city lies to the North of the Jos plateau, in the Sudan Savannah region that stretches across the south of the Sahel. Four-fifth of the state is now composed of farmed parkland, dotted with patches of shrub savannah (1). In their natural state, the soils are divided into four main groups. The Ferruginous tropical soils formed on crystalline acid rocks occupy about two fifths of the state to the South, Southwest, and Southeast, the brown and reddish-brown soils and latosols occur in the northern half; the brown and reddish soils are in the north-eastern corner, and the juvenile and hydromorphic soils occur along channel complexes.
Abdulaziz(1), ascertained that the study area has a total of nineteen (19) public primary schools, twenty-two (22) public secondary schools, and eight (8) existing institutions namely, School of Nursing, School of Midwifery both managed by the state government. Also, Aminu Kano Teaching Hospital (AKTH), Federal College of Agricultural Produce Technology, Institute for Agricultural Research, A.B.U., Kano Station, National Board for Technology Incubation all these managed by the Federal Government. The International Crops Research for the Semi-Arid Tropics and IITA Research to Nourish Africa both managed privately.
Significance of the study area
The study area is chosen specifically because of some following factors which would be explained as follows; Population, 2006 census in Nigeria acclaimed that Kano state was the most populous state in Nigeria with over 9,383,682 persons, which Tarauni LGA happens to be among. The large population within the study area accounts for a great number of children who reside there having little or no form of education. The northern part of the country where the study area lies is majorly affected with children having no education or access to information due to their cultural biases and religion. Forty per cent of Nigerian children aged 6-11 do not attend any primary school, with the Northern region recording the lowest school attendance rate in the country, particularly for girls (17).
More so, the nature of their building structures and its relationship to satellite imageries, school buildings, both public and private, are generally bungalows and are closely built besides each other which makes it difficult to be picked up by a satellite imagery, and also the clarity of the buildings on the imagery won’t be visible enough. There is a huge striking difference between the schools in the southern part of Nigeria and the northern part of the country in terms of school building structures and layout, having a full knowledge of the study area helps a long way in working within the area.
Tarauni LGA is an area I have previously worked and resided in, these would help in the quick mapping of the school's buildings within the area. Choosing Tarauni LGA as a pilot study in Nigeria would help speed up the process of training satellite imageries within the country because mapping schools in the northern part of Nigeria is more difficult and based on socio-cultural factors like religion, tribal differences and cultural beliefs.
Pilot definition
We had several options for the pilot:
- In our pilot, we could either ‘collect new data’ that is not existing, or we could go for ‘validation of existing data’ . We decided to focus on collecting the data again, that could be then used to validate the previous efforts in the area, because:From reconnaissance survey through OSM, only few data on schools was available, and captured. While this is not a true representation of the situation, this pilot study will attempt to collect and document all relevant information on schools within the study area. Different categories of schools are available within this area ranging from Primary, Secondary, and religious. Our aim is not to categorise these as they appear, rather to tag them as Schools.
- Validate existing Data: Detailed and extensive data collection exercise has been carried out within the study area by several organizations, researchers, and individuals over time. While their method of data collection cannot be verified, and the accuracy of the data cannot be guaranteed, the pilot data can serve as a benchmark on which other datasets can be validated.
Mapathon vs. volunteer engagement over a period of time: similarly, we could either engage the volunteers for a one-time effort (mapathon) or over a longer period of time. The pilot would engage and mobilize a community of individual in a participatory mapping approach. In broad sense, this means that the individuals create the data, and update the map. We chose the first approach because of the following reasons;
- The project nature requires that assistance of volunteers that have a good knowledge of the area, apart from their image interpretation.
- The project time frame is limited.
- Putting out this project open for various mappers around the world to acquire the information might be a little difficult, when it comes to managerial aspect and making sure the work is done within the project timeline.
Implementation
Stages of implementation
Crowdsource mapping Using OSM can be done in different ways; 1.) Mapping directly in Openstreetmaps. 2.) Using Humanitarian Openstreetmaps Team’s tool.
Option 1. Mapathon using the Humanitarian OpenStreetMap Team (HOTOSM)
Below are the steps that needs to be followed in order to successfully run a Mapathon
- This stage requires different volunteer logs on to OpenStreetMap to sign up for new accounts, or existing users can sign in.
- Open the tasking Manager http://www.tasks.hotosm.org, and on the main page search for the project name or project task number e.g. (UNICEF School Mapping or the Project Task number # 3450). Clicking on the project task link would direct you to the Main project task page.
- On the main project page you would find Five (5) tabs with different names on the left hand side of the page, and the Area boundary of the selected place to be mapped on the right hand side of the page, which are divided to different smaller boxes (task) all indicated by 4 different colours.
- Tasks with a yellow outline box (Cur. Worked on) are tasks where some individual mapper are currently working on, the task get locked as soon as the mapper starts mapping.
- Task with a grey coloured box (Invalidated) are the free task yet to be mapped that each volunteers can choose from.
- Yellow solid box (Done) are task completed by fellow volunteers but yet to be validated by selected validators.
- Green solid boxes (validated) represent task that have been completely mapped and validated.
Tabs
- DESCRIPTION: This pages serves as an information tab to all mappers and helps state the reason for activating the Task, and what triggered the activation. E.g., it would consist of the project background on school mapping, and the need for crowdsource mapping for school buildings.
- INSTRUCTION: This tab gives specific instructions to the mappers on what should be mapped, how it should be done, what tool should be used to map and finally the changeset comment (hashtag) chosen for the project. E.g. #UNICEFSM. Once this basic instruction is fully understood, each volunteers can make in their contribution, by clicking on “start contributes” which automatically directs you to the contribution tab.
- CONTRIBUTE: This tab requires each mappers to choose a task by their self from the selected task box marked as Invalidated, or click ”take a task at random”. Choosing the latter would allow the task manager randomly select a task marked as “invalidated” for the mappers.
- ACTIVITY: This show the list and timestamps of mappers and their activity on each selected task
- STATISTICS: shows the project completion progress as to the percentage of the overall job done in terms of task that as being fully mapped and validated.
Guides for Mappers
- From the contribution Tab, select an Invalidated task or click “take a task at random” to choose a task, and further click “start mapping”
- Start editing using the ID Editor, and new a browser tabs opens the OpenStreetMap.
- Zoom into a selected task to start digitizing, please note that all building identified as schools needs to be tagged as SCHOOL BUILDING in every task.
- Digitize using the area feature tool for all building mapped as School within your selected task, and tag each digitized building as SCHOOL BUILDING.
- Cases where School buildings have been digitized, confirm if it is properly tagged as a school building, if not tag them as SCHOOL BUILDING.
- Save your work after each edit to avoid loss of data
- Leave the changeset comment message as default i.e. #UNICEFSM #VOLUNTARYMAPPING
- Click upload to submit your work.
- Always Mark Tile as DONE in the Tasking Manager once all School Buildings are fully digitize.
Guides for Validator
Validators are experienced mappers that helps verify the accuracy of work done by each mapper on different task. These set of mappers are more experience with mapping skills, have a good knowledge of the area of study or are willing to do a ground-truthing of the attributes mapped.
Validating the mapped features requires that;
- The validators must have a very good knowledge of the study area.,
- Validators must go to the field to make sure buildings tagged as schools are actually schools on the ground.
Once the mappers are done, the chosen validators would get an overlay of the school coordinates with satellite imageries, which is then printed and taken to the field to verify the information gotten from the mappers. After Field validation is done the validators logs back on HOT to start validating the work. This is done by clicking on the contribution tab.
- From the contribution Tab, select a “Done” task, and further click “Review work”
- Start editing using the ID Editor, and new a browser tabs opens the OpenStreetMap.
- Zoom in to each task to confirm if all selected schools buildings footprints are digitized properly.
- Confirm if all selected schools are tagged “SCHOOL BUILDING” based on their attributes.
- Add names of schools and other attribute gotten from the field.
- Ensure to save all work to avoid data loss
- Mark each task as “validated” if all conditions are met otherwise mark as “Invalidated “
Pros
|
Cons
|
Easy to manage for large areas.
|
For secondary mapping, tasking manager is not suitable for mapping, because the number of features needed to map is would be small compared to the amount of tiles in the task manager. e.g. Finding specific schools in a large tile .
|
Task can be divide into smaller areas to avoid overlapping.
| |
Boundary of the study area is defined properly
|
Option 2. Mapathon using OpenStreetMap Directly (OSM)
Crowdsource mapping using the OSM platform directly can be tasking especially when working within a large area with a lot of volunteers. The OSM doesn’t have a provision for task division for all mappers/volunteers. A solution for distributing each task for all mappers to avoid overlapping of task is to divide the area into smaller units using an Open source tool known as “Field Papers”. Field Papers is a tool that helps to create a multi-page atlas of anywhere in the world. Once printed, the field paper can be taken to record notes and observations about the area you're looking at. For this Project, Field Paper Would be used as guide and to delineate the boundary where each mapper could work within a confine of a specified task. The satellite imagery printed on the field paper would serve as a guide to each mapper as regard to the specific task given to them to map.
Guides for Mappers
- Mappers also would be required to sign up for a Gmail account to ensure that all links to their mapping contributions can be dumped in a central google Doc.
- This stage requires mappers to logs on to OpenStreetMap to sign up for new accounts, or existing users can sign in.
- A link directing mappers to the project page i.e. Tarauni LGA would be provided on the google Doc to reduce the difficulty in searching or aligning the field papers to the satellite imagery on OSM platform.
- Mapper would be provided with specified “field Paper”
- Mappers should find a reference point on the field paper that align with the satellite imagery.
- Zoom into a selected task to start digitizing, please note that all building identified as schools needs to be tagged as SCHOOL BUILDING in every task.
- Digitize using the area feature tool for all building mapped as School within your selected task, and tag each digitized building as SCHOOL BUILDING.
- Cases where School buildings have been digitized, confirm if it is properly tagged as a SCHOOL BUILDING, if not tag them as SCHOOL BUILDING.
- Save your work after each edit to avoid loss of data
- Add a hashtag in the changeset comment box i.e. #UNICEFSM #VOLUNTARYMAPPING
- Click upload to submit your work.
- Finally, for every buildings tagged as “SCHOOL” copy the link of your contribution and paste in the Google Doc for validation.
Guides for Validators
Validators are experienced mappers that helps verify the accuracy of work done by each mapper on different task. These set of mappers are more experience with mapping skills, have a good knowledge of the area of study or are willing to do a ground-truthing of the attributes mapped.
Validating the mapped features requires that;
- The validators must have a very good knowledge of the study area,
- Validators must go to the field to make sure buildings tagged as schools are actually schools on the ground.
- Once the mappers are done, the chosen validators would get an overlay of the school coordinates with satellite imageries, which is then printed and taken to the field to verify the information gotten from the mappers. After Field validation is done,
- The validators clicks on each links pasted by the mappers in the Google Doc, which directs him/her to the specified building that was mapped and tagged.
- Each validator should verify that buildings mapped are tagged as “School” based on their attributes.
- Add names of schools and other attribute gotten from the field.
- Ensure to save all work to avoid data loss
- Indicate that each link as being validated right beside the link in the Google Doc.
Another option for validation is to automatically validate when certain criteria is met - i.e. if at least 3 volunteers have mapped the same building as a school, the building is ‘validated’ and tagged as school.
Pros
|
Cons
|
Easy to manage for small areas.
|
Boundary of the study area is not defined properly
|
For secondary mapping, OSM is suitable for mapping specific features, e.g., schools.
|
Task can’t be divided directly into smaller unit area to avoid overlapping.
|
It could be used for an in-house Mapathon for mappers that are trained for that specific project.
|
There is no straight way for validation directly on the platform.
|
In contrast to HOT which provides a link directly to a task, the OSM platform doesn’t.
|
Methodology workflow for the pilot study would be restricted to crowdsource mapping directly on Openstreetmaps platform, wherein the volunteers would be made to do an in-house Mapathon. This reasons is based on the fact that Tarauni LGA is a small area and the task objectives is to Tag only Identified schools as building = “school”, because most of the buildings have been digitized, this makes it easy to work directly on OSM platform because it easy to manage for smaller areas, suitable for secondary mapping and mapping only specific feature
Outputs
The output comes in place once the task has been completed by all the Mappers and Validators. This involves a process of exporting the school building footprints to the desired output format accepted by UNICEF. This involves quite a number of processes clearly stated in OSM (6).
Results from implementation
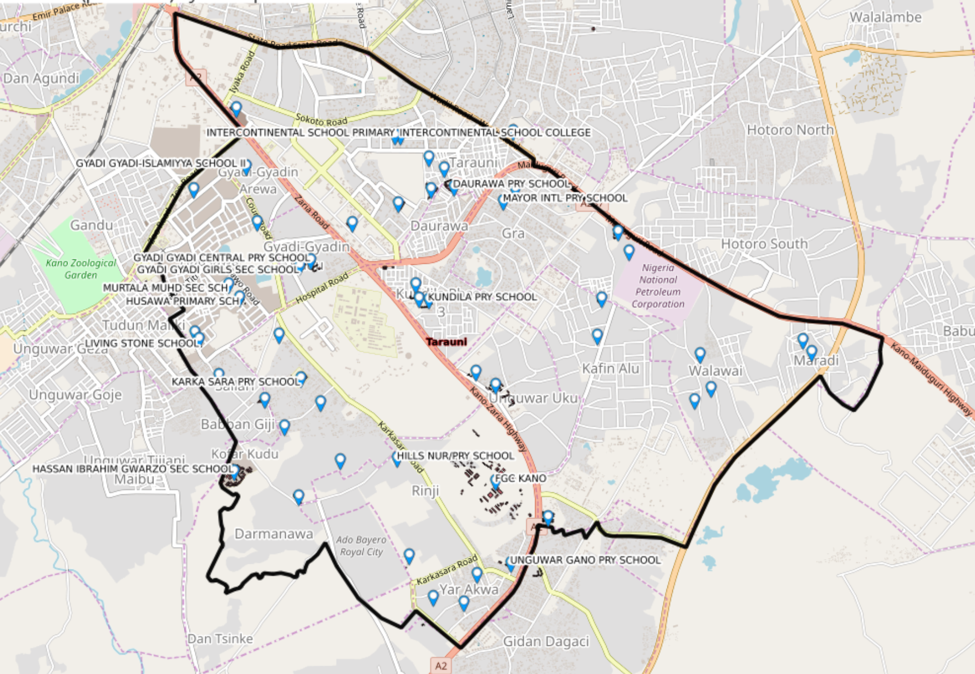
The final outcome of 52 schools were mapped after data validation was made using both Google maps and INEC Polling stations data. These school data comprise more of publicly owned schools than privately owned. The Privately-owned building structures have great similar structures with residential buildings, this would be difficult to identify from satellite imageries. Location of the mapped schools is embedded inside this link.
DATA VALIDATION
|
COUNT_OF SCHOOLS
|
MAPATHON
|
39
|
POLLING STATION
|
10
|
GOOGLE
|
3
|
Grand Total
|
52
|
Recommendations
Based on the results and lessons learned from the pilot implementation, the following recommendations are made:Adequate and fast internet should be provided for the mapathon.
- A very high-resolution imagery should be used as basemap if available
- Satellite imageries acquired within a period of 7am to 9am can be used as a strong indicator for the presence of students when they are on the assembly ground.
- A field validation should be done by few validators to ascertain the accuracy of data and also collect other ancillary data..
- Adequate training of volunteers on image interpretation skills should be made compulsory before the mapathon.
References
1. Abdulaziz Mahmud, T. (2014). Analysis of Spatial Distribution of Public Primary Schools in Tarauni Local Government Area, Kano State, Nigeria (Master’s Thesis). Regional Centre for Training in Aerospace Surveys.
2. Albuquerque, J., Herfort, B., & Eckle, M. (2017). The Tasks of the Crowd: A Typology of Tasks in Geographic Information Crowdsourcing and a Case Study in Humanitarian Mapping. remotesensing Open Access Journals. Retrieved 10 August 2017, from http://www.mdpi.com/2072-4292/8/10/859
3. Benkler. (2006). The Wealth of Networks: How Social Production Transforms Markets and Freedom. New Haven, CT: Yale University Press.
4. Caillods, F. (1983). Module I: School mapping and micro-planning concepts and processes. In F. Caillods, J. Casselli, T. N. Châu & G. Porte (Eds.), Training materials in educational planning, administration and facilities: School mapping and micro-planning in education. Paris, France.
5. Crisis mapping. (2017, July 01). Retrieved August 09, 2017, from https://en.wikipedia.org/wiki/Crisis_mapping
6. Export.hotosm.org. (2017, August 06). Export.hotosm.org. Retrieved from export.hotosm.org: http://export.hotosm.org/en/exports/create
7. Galabawa, J. C. J., Agu, A. O., & Miyazawa, I., 2002. The impact of school mapping in the development of education in Tanzania: An assessment of the experiences of six districts. Evaluation and Program Planning, 25, 23‐33.
8. Goodchild, M. (2007). Citizens as sensors: the world of volunteered geography. GeoJournal, [online] 69(4), pp.211-221. Available at: https://link.springer.com/article/10.1007%2Fs10708-007-9111-y [Accessed 8 Aug. 2017].
9. Govinda, R., 1999. Reaching the Unreached through Participatory Planning: School Mapping in Lok Jumbish, India. Paris, France, IIPE/UNESCO.Retrieved from: https://www.academia.edu/8182281/School_mapping_and_GIS (Accessed on: August 05, 2012).
10. Hong, M.N. (2014). Utilization of Crowdsourced Maps in Catastrophic Disasters (Master’s Thesis) Retrieved from http://scholarworks.sjsu.edu/etd_theses/4418
11. Martin Dodge&Roab Kitchin. (2013). Crowdsourced Cartography: Mapping Experience and Knowledge. Environment and Planning, 19 – 36. Retrieved from: http://personalpages.manchester.ac.uk/staff/m.dodge/Crowdsourced_Cartography_EPA.pdf
12. Mulaku, G., & Nyadimo, E. (2011). GIS in Education Planning: The Kenyan School Mapping Project. Survey Review, 43(323), 567-578. http://dx.doi.org/10.1179/003962611x13117748892155
13. Naroa, Z. (2016, November 16). Unicefstories.org. Retrieved from unicefstories.org: http://www.unicefstories.org/2016/11/16/creating-an-information-healthy-society/
15. Quaintance, K. (2011, 09 04). Kimo Quaintance. Retrieved from Kimo Quaintance: https://kimoquaintance.com/2011/09/04/concepts-to-know-crowdmapping/
16. Quattrone, G., Capra, L., & De Meo, P. (2015). There's No Such Thing as the Perfect Map: Quantifying Bias in Spatial Crowd-sourcing Datasets. In 18th ACM Conference on Computer Supported Cooperative Work & Social Computing (pp. 1021-1032). Vancouver, BC, Canada: ACM New York, NY, USA. Retrieved from http://dl.acm.org/citation.cfm?id=2675235
17. School Mapping | Maharashtra Remote Application Centre (MRSAC). (2017). Mrsac.gov.in. Retrieved 20 August 2017, from http://www.mrsac.gov.in/en/projects/infrastructure-mapping/school-mapping.
18. TeachOSM. (2017, August 06). TeachOSM. Retrieved from TeachOSM: http://teachosm.org/en/workflow/
19. UNICEF, n. (2005). UNICEF NIGERIA. Retrieved from UNICEF WEBSITE: https://www.unicef.org/nigeria/children_1937.html
20. Ushahidi. (2017, August 06). Retrieved August 09, 2017, from https://en.wikipedia.org/wiki/Ushahidi
21. Wikipedia. (2017, July 31). Wikipedia. Retrieved from Wikipedia: https://en.wikipedia.org/wiki/Crowdsourcing
22. Www.mapswipe.org. (n.d.). Retrieved August 09, 2017, from Www.mapswipe.org
23. Www.tomnod.com. (n.d.). Retrieved August 09, 2017, from www.tomnod.com


Comments
Post a Comment